
How Airline Route Cuts in 2026 Affect the US Economy

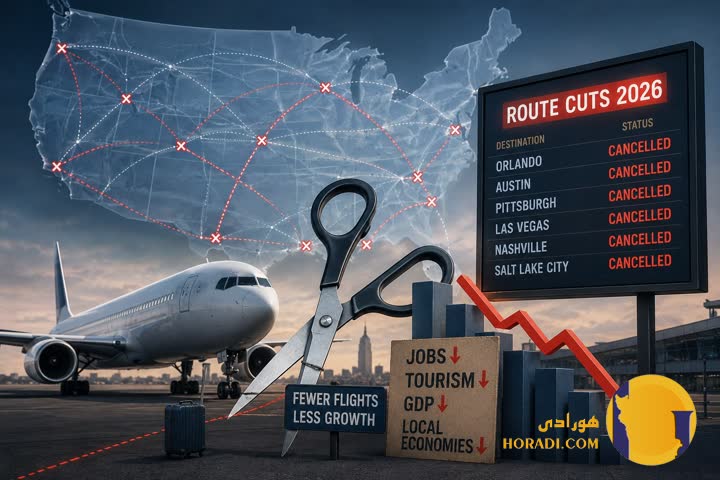
The U.S. aviation network is shrinking in subtle but economically significant ways in 2026. Airlines are trimming marginal routes, consolidating hubs, and prioritizing high-yield corridors over broad coverage. What looks like operational efficiency on balance sheets is beginning to ripple through GDP-linked sectors, especially business travel, logistics, and tourism.
The real story is not just fewer flights—it’s fewer connections between economic nodes that historically depended on cheap and frequent air access. That shift is now measurable in pricing behavior, airport activity, and regional output trends across multiple states. Market News
Key Takeaways
- Airline route cuts are concentrating air traffic into major U.S. hubs
- Business travel costs are rising due to reduced connectivity
- Smaller cities are losing economic visibility and investment access
- Cargo bottlenecks are emerging on high-demand corridors
- Tourism-dependent regions are seeing uneven recovery patterns
U.S. Airline Network Contraction in 2026
Airline networks in 2026 reflect a more selective strategy driven by yield optimization and fuel efficiency. Carriers like Delta Air Lines and United Airlines have shifted toward fewer but fuller routes.
According to the U.S. Bureau of Transportation Statistics, domestic seat capacity growth has flattened since late 2025. The trend is not collapse but compression, where marginal routes are removed first.
Hub-and-spoke models are tightening around major airports such as Atlanta, Dallas, and Chicago. Secondary airports are increasingly reliant on seasonal or low-frequency service.
This contraction changes how mobility functions in the U.S. economy. Less redundancy means disruptions now propagate faster across the system.
Causes of Route Cuts Across Major Carriers
Fuel volatility remains one of the biggest operational pressures for airlines in 2026. Jet fuel hedging strategies are no longer fully absorbing price swings.
Labor costs have also risen following renewed pilot contract negotiations across major carriers. Airlines are responding by eliminating low-margin regional routes.
The International Air Transport Association (IATA) notes global yield pressure is forcing capacity discipline. U.S. carriers are aligning with that global trend rather than expanding aggressively.
Demand normalization after the post-pandemic surge has also played a role. Business travel has stabilized at lower volumes than pre-2020 benchmarks.
Impact on Domestic Connectivity
Reduced flight frequency is reshaping how efficiently cities connect within the U.S. Some city pairs now require indirect routing through major hubs.
This adds travel time and reduces productivity for frequent flyers and consultants. Even small delays compound across multi-leg itineraries.
Connectivity loss is especially visible in midwestern and southeastern secondary markets. These regions are experiencing fewer same-day business travel options.
The network effect matters here fewer links reduce overall system resilience. That weakens the economic “stickiness” of smaller urban centers.
Business Travel Disruptions and Corporate Costs
Corporate travel budgets are rising despite modest demand recovery. Fewer nonstop routes force companies into longer, more expensive itineraries.
Consulting firms and financial services companies are feeling the impact most. Time inefficiency is translating directly into higher operational overhead.
A typical New York–Midwest trip now often includes layovers that were previously unnecessary. This reduces meeting frequency and slows deal cycles.
Expense reports show a steady rise in per-trip costs across major corporations. Airfare inflation is now partially structural, not purely cyclical.
Tourism and Hospitality Sector Pressure
Tourism-heavy states are seeing uneven visitor distribution due to route changes. Florida and Nevada remain strong, while smaller destinations are struggling.
Hotel occupancy in secondary cities is increasingly dependent on regional flights. When those flights disappear, demand drops almost immediately.
National Park gateway cities are also affected by reduced direct access. This shifts tourism toward larger, more connected entry points.
The American Hotel & Lodging Association reports slower recovery in mid-tier markets. Air connectivity remains a leading predictor of regional tourism performance.
Cargo and Supply Chain Implications
Air cargo networks rely heavily on passenger flights for belly capacity. Route cuts therefore reduce freight availability even when demand remains stable.
Time-sensitive goods such as electronics and medical supplies are most affected. Shippers are shifting to dedicated cargo carriers at higher cost.
Major logistics corridors like Los Angeles–Chicago–New York are absorbing volume. Secondary airports are losing relevance in air freight distribution chains.
This concentration increases vulnerability during weather or operational disruptions. Supply chain flexibility is declining in measurable ways.
Regional Airports and Small City Decline
Regional airports are the most exposed segment of the aviation ecosystem. Reduced service frequency makes them less attractive for airline reinvestment.
Cities like Des Moines, Omaha, and Tulsa are seeing tighter route schedules. This reduces their appeal for corporate headquarters expansion.
Local economies depend heavily on predictable air access for investment inflows. When connectivity weakens, capital allocation tends to shift elsewhere.
Airport revenue also declines due to fewer passengers and lower ancillary income. This creates a feedback loop of declining service and infrastructure strain.
Ticket Prices and Consumer Behavior Shifts
Airfare pricing in 2026 reflects reduced competition on thin routes. With fewer carriers operating certain segments, pricing power increases.
Consumers are responding by booking earlier or choosing alternative hubs. Drive-to-airport behavior is increasing in several metropolitan regions.
Budget airlines are focusing on high-density leisure routes rather than broad coverage. This leaves business travelers with fewer low-cost alternatives.
Price dispersion between hubs and secondary airports is widening noticeably. The market is becoming more segmented and less flexible.
Labor Market and Airline Operations Pressure
Airline workforce allocation is shifting alongside network restructuring. Ground staff and regional crews are experiencing uneven demand.
Pilot shortages remain a structural constraint despite route reductions. Fewer routes do not necessarily translate into proportional labor reductions.
Maintenance scheduling is becoming more centralized around major hubs. This increases operational efficiency but reduces regional autonomy.
Union negotiations are increasingly focused on stability rather than expansion. The industry is entering a consolidation-driven labor phase.
Macroeconomic Impact on U.S. GDP
Air transportation contributes both directly and indirectly to U.S. GDP. Route cuts reduce multiplier effects in tourism, logistics, and services.
Economists tracking mobility-linked productivity note slower regional convergence. Smaller cities are contributing less to national growth dispersion.
The Federal Aviation Administration (FAA) has flagged capacity imbalance risks. These risks include congestion in hubs and underutilization elsewhere.
Overall GDP impact remains moderate but persistent across quarters. The concern is structural drag rather than short-term shock.
Technology and Route Optimization Strategies
Airlines are increasingly relying on AI-driven route planning systems. These systems prioritize profitability over geographic coverage.
Dynamic pricing and demand forecasting now determine route viability faster than before. Unprofitable routes are eliminated within shorter evaluation cycles.
Aircraft utilization rates are being maximized through tighter scheduling. This reduces idle time but limits flexibility in disruptions.
Digital twins of network performance are now standard among major carriers. Optimization is efficient—but not always geographically equitable.
Final Verdict
The 2026 wave of airline route cuts is not a crisis in the traditional sense. It is a structural recalibration of how air mobility aligns with economic returns.
Large hubs are strengthening while smaller markets absorb connectivity losses. That imbalance is reshaping how capital, labor, and tourism flow across the country.
The long-term question is whether efficiency gains outweigh regional economic fragmentation. Right now, the evidence suggests both are happening at the same time.
FAQ
Airline route cuts are generating complex economic questions across industries. Below are key FAQs reflecting current 2026 market concerns and structural trends.
Q1 Why are airlines cutting routes in 2026? Primarily due to fuel costs, labor pressures, and lower-margin route elimination. Airlines are prioritizing profitability over geographic coverage expansion.
Q2 Which sectors are most affected by reduced flight connectivity? Business travel, tourism, logistics, and regional real estate markets are most exposed. Each relies heavily on predictable and frequent air service.
Q3 Are ticket prices increasing because of route cuts? Yes, especially on routes with reduced competition or fewer carriers. Pricing power shifts to airlines when alternatives disappear.
Q4 How do route cuts impact small U.S. cities? They reduce investment access, tourism inflow, and corporate relocation attractiveness. Over time, this can slow regional economic growth.
Q5 Will technology reverse the impact of airline consolidation? Technology improves efficiency but does not replace physical connectivity needs. It optimizes networks rather than expanding them geographically.